Last year in September I had a serious health accident.
Apparently after years of being decently fit, my body decided that enough was enough, and it would shut itself down with a not-so-great timing.
This sparked some interest in the small portable computer I’ve been keeping at my wrist for the last 5 years. I more-or-less monitored some basics daily for that time, but never put serious thought into analyzing that data myself.
Something that I let Fitbit do for me, for a good while.
While their in-app suggestions are usually good, the data visualization can be a bit limited, both in the phone app and their website.
It’s easy to scroll through a couple days, a couple weeks or even a month, but being an IT guy, what I always missed were some nice bars and lines, lined up in series, describing behavior over much longer periods – a few months or years.
I was already tinkering with Fitbit APIs before the accident, but I never had the time to put it together into a finished project.
Fitbit allows you to retrieve your data in two ways:
- the archive export: going to fitbit.com and logging in with your account, you can retrieve an archive export of your whole account in a few clicks
- is static data
- is a one-time operation
- gives you everything, including intra-day series
- the web APIs: you can setup a script to export your data periodically and save it somewhere else
- is dynamic data
- is a periodic operation
- unless you ask Fitbit, you only have access to “normal” series, but not intra-day series
The first attempt was to load the Archive export into a time-series database, since parsing many JSON files is a bit easier than periodically retrieving data from some web endpoint.
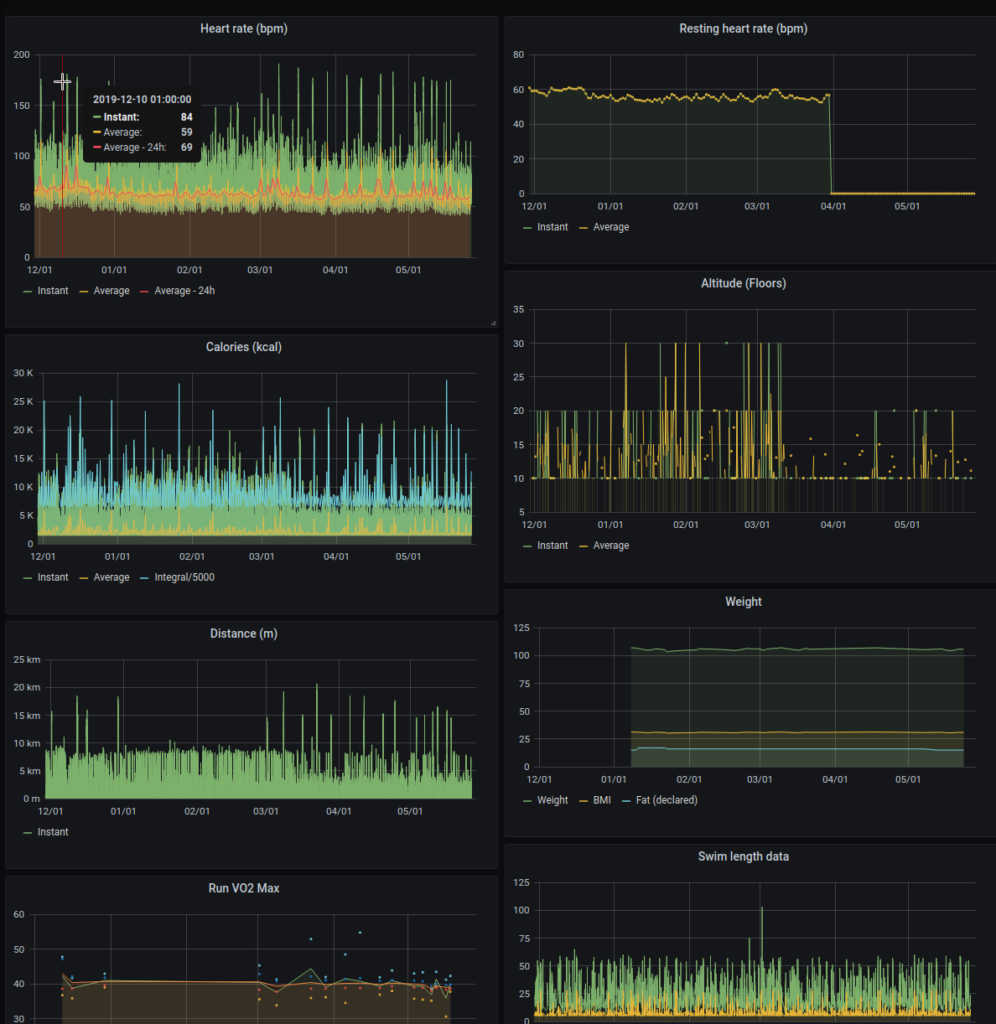
It required a bit of parsing, but in the end I managed to import the data into InfluxDB and graph it via Grafana.
It wasn’t perfect, but it was a start.
The next goal was to stop having to run the export-load every week, so I looked into the Web APIs.
I initially had trouble finding a decent python client for the fitbit web APIs. Finally, after a bit of research, I landed on this project.
After a lot of fiddling with the client, the server replies and the resulting DB schema, I managed to create another Influx database parallel to the first one, and load the web API time series there.
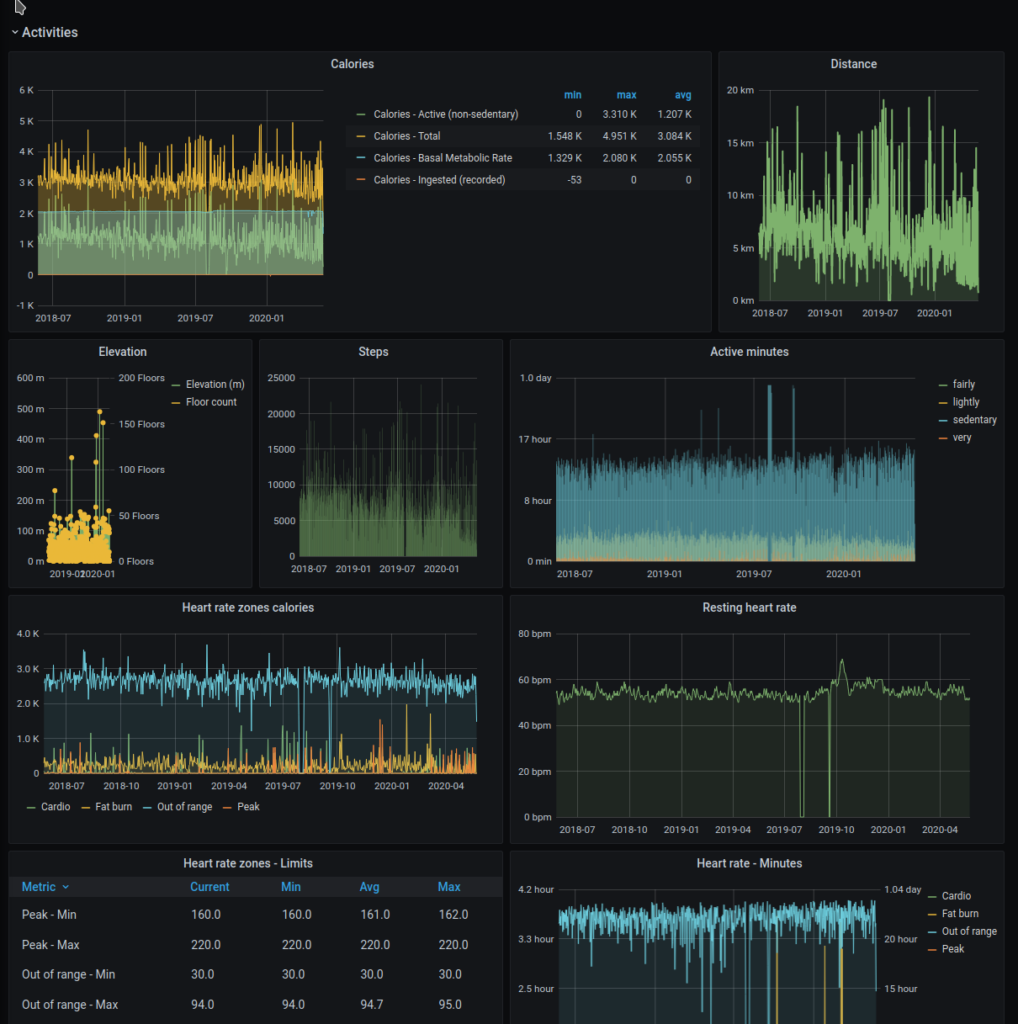
The resulting Grafana dashboard is quite clean and immediate.
As mentioned above, the web APIs do not offer intra-day time series out of the box.
You can ask Fitbit for permission to use them, but I did not implement them in my project. There are a couple reasons, mainly that they are too much work for what they are worth, and you can still sync, say, once per month via the Archive export. Intra-day time series consist of a lot of data, and a once-a-month export is probably the better way to retrieve them rather than continuously polling their web API. Not to mention that the whole idea was to see trends on longer time-periods, so 1s, 15s or 30s series are not really useful in that context.
You can browse the fitbit-api-exporter project at Gitlab.
The project provides a single docker image with a sample docker-compose file.
The docker image has two entry scripts that can be used as commands, and the instructions in the README should be enough to get you started with both (archive export and API exporter).
The archive export loader script will require you to manually execute a docker command with the image, passing a few parameters as environment variables.
It requires you to have first pulled up the provided docker compose to create the database and fitbit-exporter network.
docker run -it --network fitbit-exporter -v:/dump -eDB_HOST=… -eDB_PORT=… -eDB_USER=… -eDB_PASSWORD=… -eDB_NAME=… registry.gitlab.com/fsvm88/fitbit-api-exporter:latest /fitbit_export_loader.py
Notice that the “fitbit-exporter” network is the one defined in the docker-compose. Unless you expose your services via ports: statement or you expose them publicly on some server, the idea is to use the internal docker DNS resolution to access your database.
The web API poller instead is the default command of the docker image, and only requires you to provide the required environment variables to access your data via the Fitbit APIs.
It will run forever, and the restart: always will ensure that it restarts in case of unexpected failure. I’ve only ever observed it crash due to the underlying Fitbit API client using HTTP instead of HTTPS for requests, for whatever reason.
It’s probably best to comment out the restart: always until you observe in the image log that the client is properly polling the APIs. This is to avoid maxing out your API credit (for 1h) before you can actually sort out whether the environment variables you provided to the container actually work.